Garren Work, MBA
VP, Mergers & Acquisitions Advisor for Businesses <$100MM
Click here to view original article
Determining whether the Lower-Middle Market (LMM) favors buyers or sellers isn’t straightforward. Outliers and industry-specific trends can obscure the overall picture. Still, the evidence is clear: today’s LMM is a hot seller’s market, though affordability pressures and a lingering cold fringe remain.
Before diving into the numbers, let’s define the key terms we use to describe the market. Here are the key factors we examine when assessing the market:
Hot / Cold – This indicates market activity and expected time to close. Metrics to review:
- Days on Market / Time to Closing
- Offer Activity & Competition
Buyer / Seller – This indicates which party holds more leverage in negotiations, more options, or alternatives. Metrics to review:
- Inventory / Supply relative to Sales
- Trends in Multiples
Hot vs Cold Market Analysis
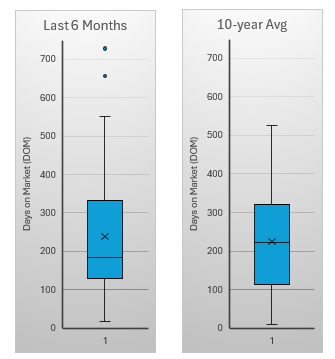
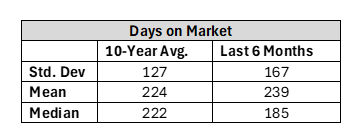
Days on Market
Listings are closing faster than historical norms. Median DOM has sped up to 185 days – about 17% faster than the 10-year median – a clear “hot” signal. Yet the mean DOM remains above the benchmark, pointing to a small but notable group slower moving businesses. On average, most businesses are moving quickly, while others may be dragging.
Signal: Hot Core; Cold Fringe
Offer Activity
Our recent listings see more offers arrive faster than usual, far above typical expectations. Buyers are more aggressive in making offers and aren’t afraid to come up on price, but they’re structuring cautiously with cash – often seeking seller financing signaling careful underwriting.
Signal: Hot Market, but with affordability pressure
Conclusion: Hot Market
The LMM appears hot, but not without challenges. A small minority of deals still move slowly due to factors like historical financial fluctuations, tariffs, or other complexities that require additional buyer diligence. Cash limitations align with persistently high interest rates and/or concerns over historical trends. For owners, this means preparation is critical. Sellers who can present clean historicals and proactively address tough questions will stay in the hot core of the market.
Buyer’s vs Seller’s Market Analysis
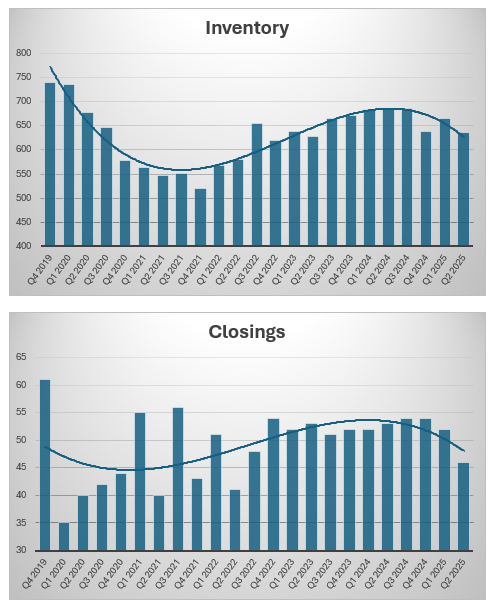
Inventory / Supply
Inventory is broadly in line with historical averages, but fell 5% over the past year, making the market slightly leaner. Sales are slower – roughly 7% below the 5-year average and 14% lower than last year but not impacting inventory levels – indicating a lack of supply. Overall, we see modest tightening.
Signal: Seller’s Market
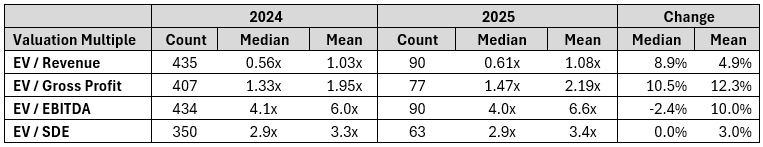
Trend in Multiples
Multiples tell an interesting story: Median EBITDA and SDE are largely flat, with EBITDA down a tick from 4.1x in 2024, to 4.0x in 2025. However, all other measurable metrics are up including EBITDA mean jumping 10% to 6.6x in 2025 (up from 6.0x in 2024), reflecting a handful of standout deals commanding substantial premiums. Revenue multiples are modestly up in 2025 (median 0.61x vs. 0.56x in 2024), showing steady interest relative to top-line performance.
Signal: Seller’s Market – especially on standout deals
Conclusion: Seller’s Market
Tightening inventory and lagging new listings reinforce this seller’s market. While multiples show mixed signals, standout businesses continue to command substantial premiums -keeping leverage with sellers. With supply tightening and multiples stable-to-rising, sellers hold the advantage. Business owners considering an exit should act before pressures temper buyer activity.
Final Thought
Overall, the Lower-Middle Market is firmly in seller territory – especially for well-prepared businesses. If you’re considering an exit in the next 12-24 months, positioning your company now could be the difference between landing in the hot core with rising valuations or risk being left in the cold fringe.
Detailed Analysis:
Days on Market
- Source: DealStats
- Approach: Randomized Systematic Sampling
- Criteria: All Industries, Revenues: $2M – $250M, Profitable, Removed extreme outliers: datapoints beyond 3 standard deviations
Control Group:
- 60 datapoints
- Period: 2015 – 2024 (10-years)
- Removed 3 extreme outliers, or 5% of samples
Target Group:
- 40 datapoints
- Period: March 2025 – September 2025 (6 Months)
- Removed 2 extreme outliers, or 5% of samples
Inventory / Supply
- Source: BizBuySell Insight Report
- Criteria: Central Florida
- Note: While BizBuySell’s data skews towards MainStreet businesses – it is indicative of the private marketplace for privately-held businesses in the Lower-Middle Market
Multiples Trend
- Source: DealStats
- Criteria: All Industries, Revenue between $2M and $250M, Profitable
- Group 1: 2020-2024
- Group 2: 2025 (95 Transactions)
- Removed the top 5% of EBITDA Multiples